(I’m embarrassed to say that this blog post should have gone out in Feb 2023 as that is when a draft was written below – but time got away from me).
This is one of the parts of my job that I enjoy – rethinking and redesigning lessons to better support curriculum. One example recently came from the Wellness department. In Wellness I classes, students are asked to take a look at food that they eat and document nutritional facts. The idea here is for students to get a general idea as to what they eat and how their decisions relate to the daily recommended allowance.
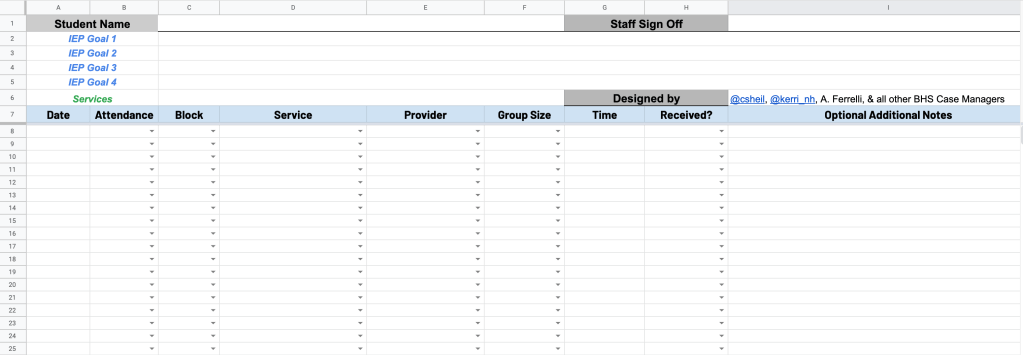
To make this happen, students are asked to document food that they would eat over a span of two days at restaurants. Using a nutrition calculator, students are able to find accurate nutritional facts. Once students document their own data, they are asked to answer questions comparing their results to the daily recommended allowance. Students in the past were given a google document similar to the image below.
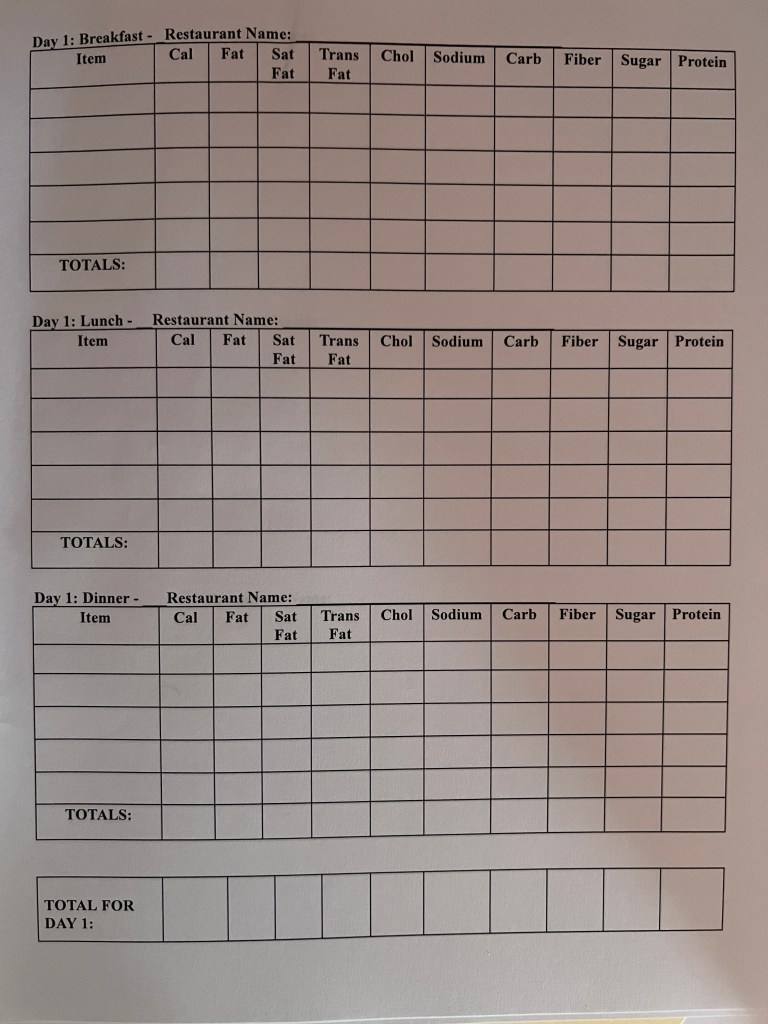
With this document, all information is provided in a one stop shop. A nutritional calculator is provided, tables are clearly labeled prompting students with the necessary information needed, and follow up questions are provided. Students are asked to complete the worksheet.
Continue reading “Rethinking and Redesigning Lessons using Spreadsheets”

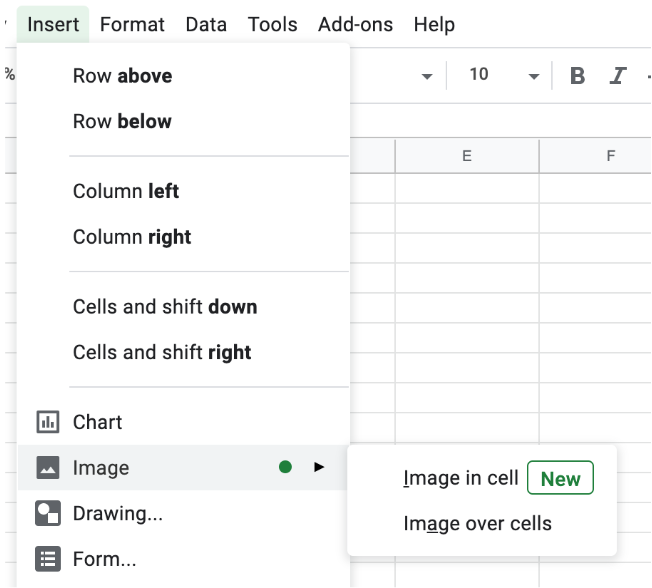
 On this seventh day of Google, we will be taking a look at a couple of Google Sheet features.