

Last February, I had the opportunity to attend SXSWedu Conference in Austin, TX. Google set up a space at the conference where attendees would walk through different Google activities over the span of 45 minutes. Each activity pertained to a common theme of recycling. While attendees were waiting to experience the three different stations, we were asked to fill out a Google Form and answer questions. Once submitted, we were brought to an infographic showcasing data from all those that had already completed the form. The infographic was constantly being updated. I thought that this was really cool taking data to the next level. Yes I have heard of infographics before, but I had not seen infographics being updated in real time. It was VERY COOL. I noticed that the tool that was used to make this happen was something called Google Data Studio (datastudio.google.com). I knew that this was going to be a future challenge for myself to take a look at.
Wouldn’t you know, October arrived and I had yet to push myself to play around with Google Data Studio. It is amazing how quickly time flies by. Thankfully, it was brought to my attention that Laura Tilton was offering a one day workshop on the tool.
I can’t say enough with how cool and useful this tool is. Let’s put things into perspective.
Showcasing Data
Each year, the Social Media Awareness Committee at our high school asks 9th grade students to complete a survey on their social media use. That information was compiled in a Google Slide where screenshots of the data was pulled from the Google Form. (The data was actually shared with the freshmen class in a full class theater presentation). Click on the link HERE to view the presentation in a new window.
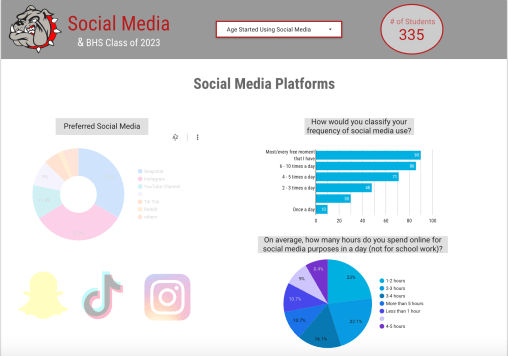
After attending the Google Data Studio training, I was able to take the same data and make it dynamic, meaning that viewers are able to interact with the data based on what they are interested in knowing more about. Click on the link HERE to view the data in a new window and interact with it! (The image below shows what the first page of the dashboard looks like. By selecting the dropdown menu, you can look at your data accordingly).
I see a lot of potential with Google Data Studio. It all comes down to sharing data the right way. I most certainly prefer viewing data in such a way that I can interact with it rather than looking at the data in screenshot mode. The data from a Google form is nice for a quick overview so that you don’t have to do anything. Love that feature. However, when you need to dive down further into data, Google Data Studio is the way to go.
For instance, with this data set, you can have it set so that you see
- Data from students who started using social media when they were 11
- Then select snapchat from the chart as the most preferred social media platform
By selecting these two filters, you now see data only pertained to students who started when they were 11 and prefer snapchat. This is something that you really cannot get quickly from Google Form charts and graphs.
There is a time and place for Google Data Studio. I won’t lie, it does take some time to get a Google Data Studio dashboard up and running. You probably wouldn’t use this every time you have Google Forms. If you are interested to know more about Google Data Studio or how it can be used in your curriculum, you know where to find me.
And that is my Spiel…

One thought on “Google Data Studio: Interact with your Data”